创意/生活
Food Memory Retention Analysis Infographic Design
by Vision AI (晓雪)
Fill in the variables
0 / 2Fill in the values, then click Create Yours — they'll replace the {xxx} placeholders and jump to Studio
Full prompt (English — copy this into Studio)
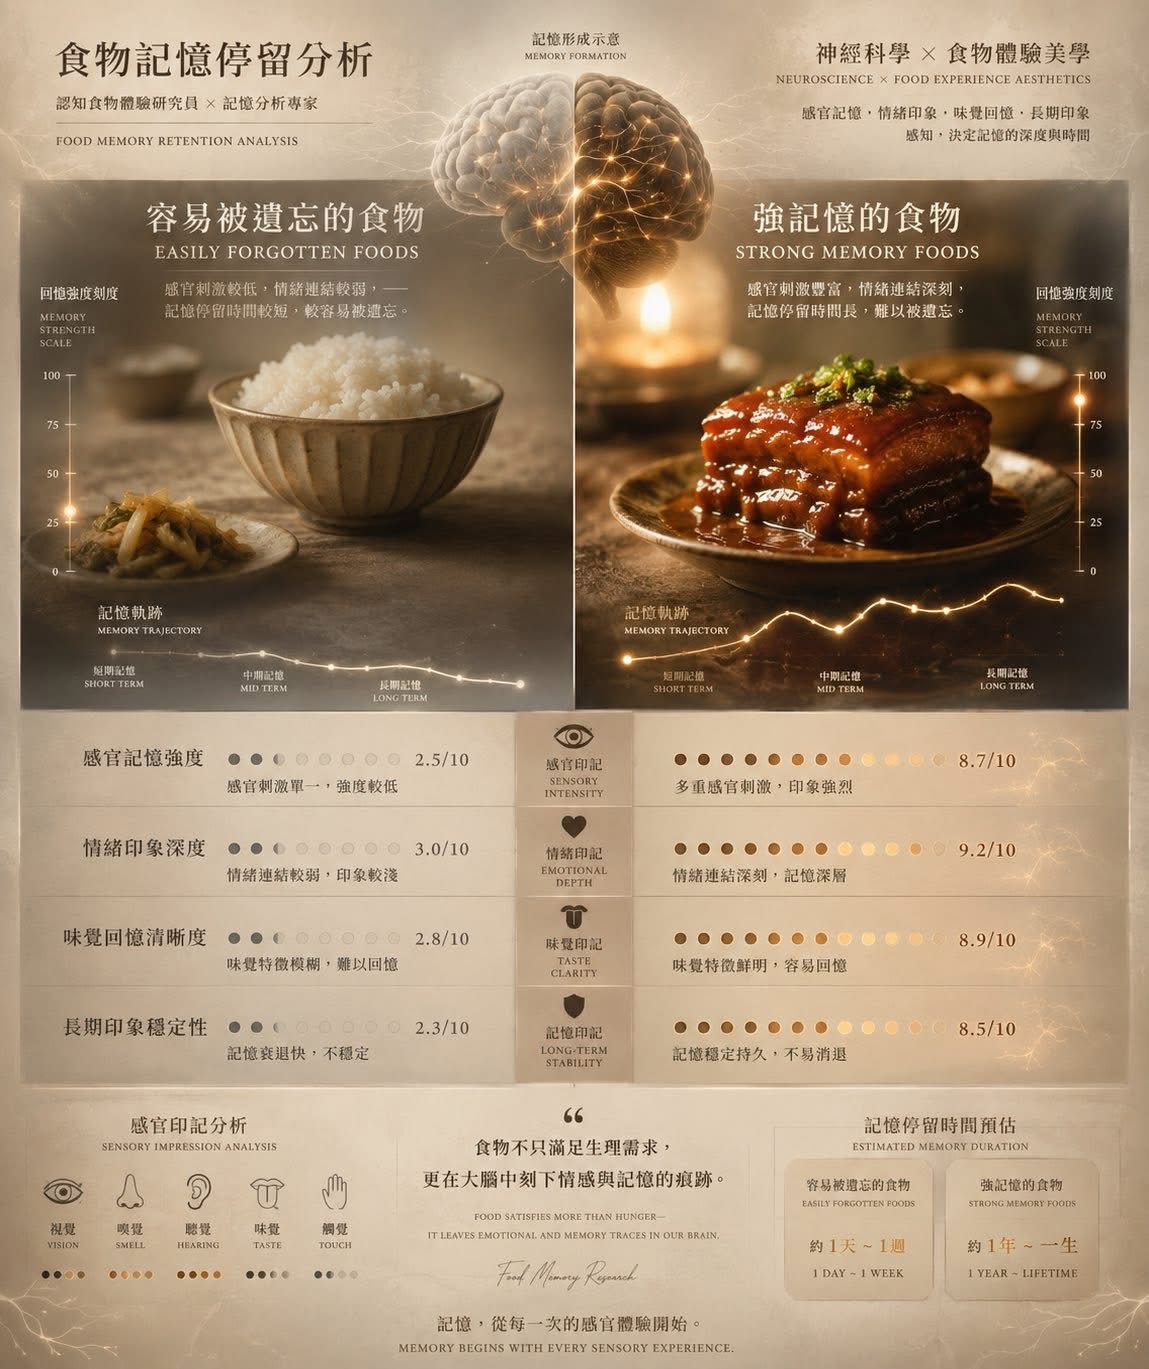
A split-screen infographic comparing food memory retention. Left side features {food_left} presented simply, with a dim, fading memory trajectory graph indicating low sensory impact. Right side features {food_right} presented richly with sauce and garnish, accompanied by a glowing, rising memory trajectory graph indicating high emotional and sensory connection. Top center shows a split brain illustration: left side dull, right side glowing with neural activity. Bottom section includes detailed data panels for sensory intensity, emotional depth, and taste clarity with dot-matrix ratings. Vintage scientific aesthetic, warm beige and gold color grading, soft cinematic lighting, high detail, 8k resolution.