餐饮/美食
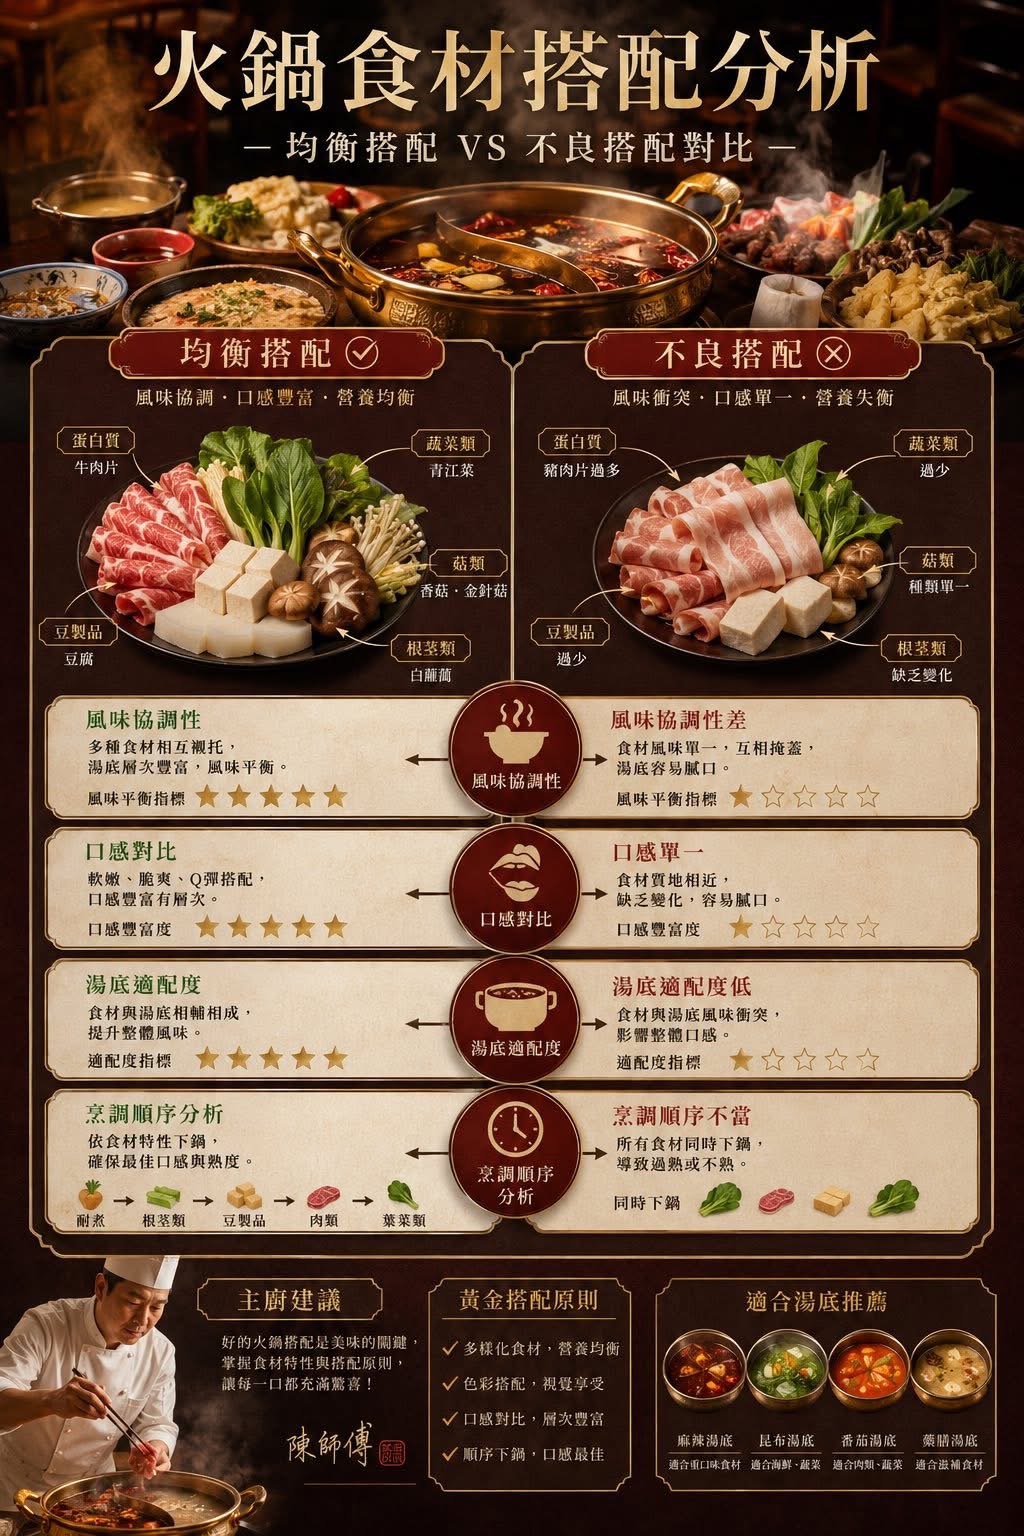
Hot Pot Ingredient Pairing Analysis Infographic Design
by Vision AI (晓雪)
Fill in the variables
0 / 1Fill in the values, then click Create Yours — they'll replace the {xxx} placeholders and jump to Studio
Full prompt (English — copy this into Studio)
Vertical infographic layout for {food_theme} pairing analysis. Top Hero Section: Large elegant title text in gold serif font, steaming central {food_theme} pot surrounded by raw ingredients like fresh greens and meats, cinematic warm rim lighting, steam rising. Middle Section: Split-screen comparison on dark wood texture background. Left side 'Balanced Pairing' showing a diverse plate of marbled meats, white tofu, enoki mushrooms, and leafy greens. Right side 'Poor Pairing' showing a monotonous plate dominated by fatty pork. Lower Section: Four horizontal comparison rows with central circular icons (steaming pot, lips, bowl, clock), 5-star rating systems, and descriptive text blocks on parchment texture. Bottom Section: Professional chef in white uniform on left, checklist of golden principles in center, and four small bowls of different broths on right. Style: High-end culinary infographic, traditional Chinese aesthetic, dark brown and gold color palette, 8k resolution, photorealistic food elements, sharp focus, UI elements include rounded rectangular text boxes with gold borders.